Article from Earth Observatory
Every year, scientists at the University of Maryland publish new data about the state of Earth’s forests based on observations from Landsat satellites. As has often been the case in recent years, the update for 2020 painted a bleak picture. In that one year, Earth lost nearly 26 million hectares of tree cover—an area larger than the United Kingdom.
The raw numbers can tell us how much and where forests were lost, but they do not explain what was driving those losses. How much deforestation was due to wildfires? Food production? Forestry management? An ongoing effort by researchers from The Sustainability Consortium and the World Resources Institute (WRI) attempts to answer such questions with maps and datasets that categorize and quantify the major drivers of annual forest losses. In doing so, the researchers have put a spotlight on the impact that food production has on forests, particularly in the tropics.
In 2020, for instance, Earth lost about 4.2 million hectares (16,000 square miles) of humid tropical primary forest—an area about the size of the Netherlands. Nearly half of that, their analysis shows, was due to food production, and half of that was due to commodity crops. In recent years, commodity crop production has pushed rates of forest loss to record levels.
The map above, based on an analysis of Landsat data by The Sustainability Consortium and WRI, highlights several key drivers of forest loss. Shifting agriculture (yellow) typically involves the clearing of small plots within forests in Africa, Central America, and parts of South America. The clearing is done by subsistence farmers, often families, who raise a mixture of vegetables, fruits, grains, and small livestock herds for a few years and then let fields go fallow and move on as soil loses its fertility. The practice is especially common in Africa, and has become more so since 2000 due to increasing human populations.
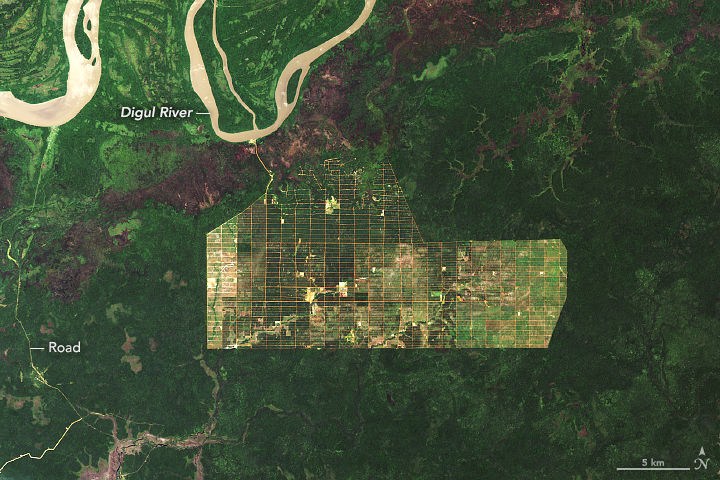
In South America and Southeast Asia, commodity crops (tan on the map) have become the dominant driver of forest loss. Common commodity crops include beef, soybeans, palm oil, corn, and cotton. They are typically grown on an industrial scale and traded internationally. Unlike the temporary forest clearings associated with small-scale agriculture, commodity-scale production often involves clear-cutting and results in significant impacts on forests (like the Indonesian palm oil plantation below).
“In many cases, commodity-driven deforestation is essentially a permanent change compared to shifting agriculture,” explained Christy Slay, a conservation ecologist and the senior director of science and research applications at The Sustainability Consortium. “These areas will likely never be forests again.”
In contrast, forests cleared for forestry management or by wildfires generally grow back over time. In the U.S. Southeast, for instance, managers maintain certain ecosystems and animal habitats by periodically burning and planting forests to mimic natural cycles of burning and regrowth. Likewise, forests in the Pacific Northwest and Europe are often managed for timber in ways that cycle between periods of forest clearing and periods of regrowth.
Note that food production was once a major driver of deforestation in North America and Europe, but much of the clearing happened a hundred or more years ago. Since many forests in these areas were already gone by 2000, their absence does not register as forest loss. Nor does the map capture the impact of large-scale conversion of natural grasslands to agriculture, a common practice in both North and South America.
With tropical forest cover dwindling and the effect of climate change becoming more acute, some companies and consumers are trying to ensure that food production does not lead to new deforestation. In recent years, hundreds of companies have committed to eliminating or reducing products in their supply chains that cause deforestation. But ensuring that is often challenging.
“Global supply chains can be complicated and opaque,” said Slay. “You often have companies buying commodities off the spot market, such that the source regions change frequently or even daily. Retailers and food manufacturers often don’t know the source of their ingredients down to the individual farm and field scale.”
By regularly collecting data on the health of forests, satellites are making it easier for scientists to untangle which commodities and regions are the biggest contributors to deforestation. Doug Morton, a forest ecologist at NASA’s Goddard Space Flight Center, has witnessed a shift in the dominant drivers of deforestation.
“Forty years ago, we often saw small-scale deforestation creating roads that look like fishbone patterns,” said Morton, who monitors agricultural frontiers in the Amazon. At the time, many people were moving into the Amazon to escape drought and hunger in eastern Brazil. “By the middle of the Landsat record, we see large-scale commodity production taking hold. Today’s deforestation isn’t about individual families. It’s often tractors and bulldozers clearing large tracts of forest for industrial scale cattle ranching and crops.”
For companies trying to keep their supply chains free of deforestation, knowing which commodity crops are being grown where is critical. “If we know where deforestation is common and what crops are involved, we can go to companies and say: ‘Be careful if you’re working with suppliers that are sourcing this particular product from this particular part of the world,’ ” said Slay. “Satellite data of forest change and loss is the first step in the process.”
One recent WRI analysis combined Landsat imagery with economic and land-use data to parse the impact of seven different commodities on forests around the world. “One of the big things you notice in the data is the outsized role of cattle pastures in driving deforestation,” said Mikaela Weisse, one of the report’s authors. “Cattle pastures caused about five times more deforestation than any of the other commodities we analyzed.”
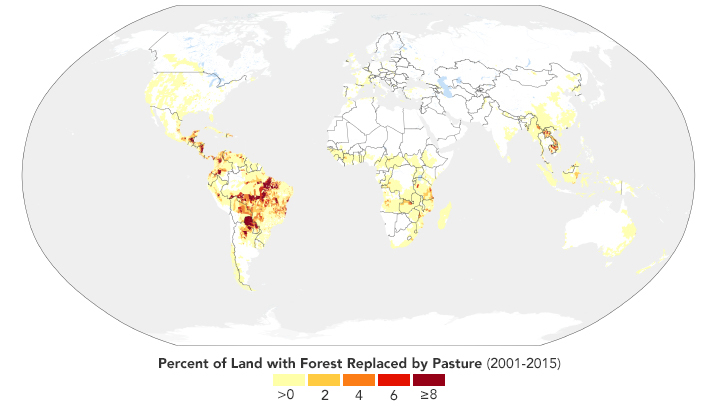
The map above shows forests being cleared for cattle all over the world, but particularly in Brazil, where deforestation has been on the rise. Large tracts of forest have also been cleared in Paraguay, Bolivia, and Peru according to WRI data.
In Southeast Asia, where deforestation rates have dropped recently, most forest losses are associated with palm oil, which is used in many types of processed foods and various health and beauty products like deodorant, shampoo, toothpaste, soap, and lipstick. Deforestation for cocoa production had a sizable impact in certain countries—notably Ghana and Côte d’Ivoire—but only represented 3 percent of total forests losses. Other commodities with similarly modest effects on global forests included rubber, coffee, and wood fiber.
While new tools are making it easier to understand where food production is intersecting with new deforestation, huge challenges remain. “Deforestation rates are going up instead of down,” said Elizabeth Goldman of WRI. “There’s a lot of work left to do.”
NASA Earth Observatory images by Lauren Dauphin, using data from Curtis, P.G., et al. (2018), data from Goldman, Elizabeth, et al. (2020), and Landsat data from the U.S. Geological Survey. Story by Adam Voiland.


