According to the FDA’s August 21, 2026 update, an outbreak of Salmonella Javiana linked to recalled fresh jalapeños resulted in 431 reported illnesses and 57 hospitalizations across 32 states. Fortunately, no deaths have been reported.
Epidemiological and traceback evidence identified a likely grower in Sinaloa, Mexico, with peppers distributed in the United States by Coast Citrus Distributors. The recalls were not limited to whole fresh peppers in grocery produce bins: the affected jalapeños had already been processed into salsas, guacamole, dips, dressings, prepared meals, and restaurant menus across multiple sales channels.
By the time an outbreak is identified, a single contaminated ingredient can disperse across dozens of product lines, retail brands, and food service operations. The episode puts a familiar retail challenge in plain view: many companies still lack visibility beyond their immediate suppliers.
What CommodityMap enables commodity and produce buyers to see when origin is unknown
When companies do not have full visibility into their commodity supply chains, they face a critical blind spot. The core purpose of The Sustainability Consortium’s CommodityMap is rooted in helping companies understand where agricultural commodities are likely grown and which environmental and social priorities are associated with those locations.
When buyers only know where they purchased an ingredient (not where it is grown)—such as a broker or distributor in the United States sourcing jalapenos—CommodityMap empowers them to estimate likely points of origin based on global trade flow models.
To evaluate a baseline risk exposure for jalapenos, we modeled a normalized supply of one metric ton of fresh peppers purchased in the United States without specifying a farm location:
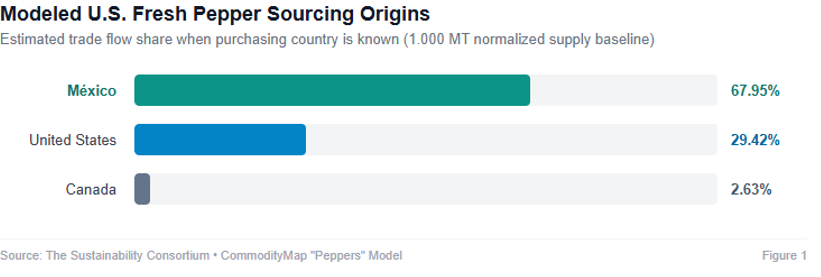
Figure 1. Modeled sourcing origins when only the United States purchasing country is known. CommodityMap identified Mexico as the primary origin (67.95%), followed by the United States (29.42%) and Canada (2.63%). Percentages reflect modeled trade flows of pepper production entering the U.S supply, not documented disease outbreak volumes.
This baseline analysis allows procurement teams to identify where their supply is structurally concentrated and provides an immediate starting point for supplier data collection and due diligence.
Connecting institutional governance to food safety
While CommodityMap does not detect pathogens or identify the specific cause of contamination, its risk indicators provide essential context. When CommodityMap evaluates sourcing regions, it assesses Institutional Governance Risk—highlighting potential vulnerabilities in local regulatory enforcement, legal oversight, and compliance monitoring.
In agricultural supply chains, national governance baselines set the foundation for on-the-ground operational safeguards:
- Consistent oversight of agricultural water quality and irrigation sources
- Inspection of sanitation standards across harvesting and packinghouse operations
- Farm-level recordkeeping, worker safety standards, and chain-of-custody documentation
This systemic link between governance, agricultural water, and food safety is well documented across produce supply chains. In the leafy greens sector, recurring E. coli outbreaks linked to romaine lettuce (such as in Yuma, Arizona and the Salinas Valley, California) demonstrated that agricultural water quality, irrigation canal proximity, and local oversight are the decisive determinants of microbiological contamination.
Importantly, institutional governance risk in CommodityMap is assessed at the national level across Mexico at 0.681 [HIGH], a baseline that remains uniform regardless of the specific state. When governance risk is high, brand owners and buyers cannot simply assume food safety, water testing, and traceability based on local public standards alone—they must invest in proactive private verification.
Beyond Food Safety: Biodiversity as the key regional differentiator: Sinaloa vs. Chihuahua
Because Mexico’s institutional governance score is identical nationwide (0.681), governance alone does not explain why specific growing regions carry distinct operational vulnerabilities.
Instead, biodiversity represents an additional, critical risk factor in this situation given where the jalapeños were sourced.
When buyers move from a national assumption to sub-national state-level data, CommodityMap reveals that environmental priorities diverge sharply across producing regions.
To examine this contrast, we compared the outbreak origin (Sinaloa) directly against an alternative major Mexican pepper-growing state (Chihuahua):
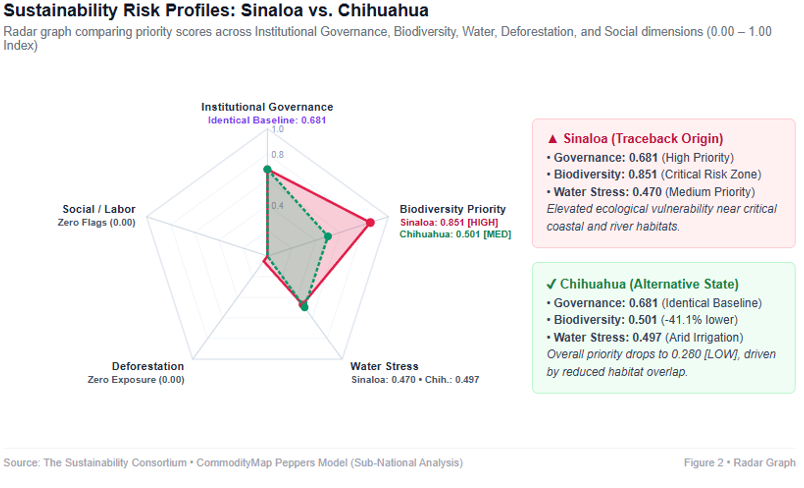
Figure 2. Radar graph comparing sustainability risk profiles across Institutional Governance, Biodiversity, Water Stress, Deforestation, and Social dimensions (0.00 – 1.00 Index). Both states share an identical national governance baseline (0.681), but diverge in ecological sensitivity.
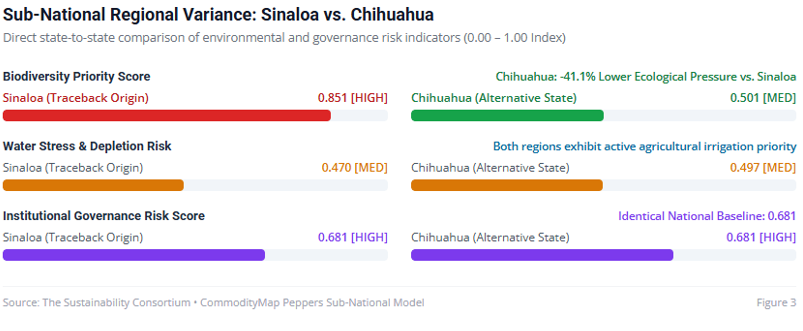
Figure 3. Direct state-to-state comparison between Sinaloa and Chihuahua, illustrating substantial variance in biodiversity pressure alongside consistent water stress and governance baselines.
The direct state-to-state comparison reveals critical operational insights beyond governance:
- Biodiversity Sensitivity
Sinaloa State (Traceback Origin) registers an elevated biodiversity priority score of 0.851 [HIGH], placing it in the Critical Risk Zone due to pepper cultivation overlapping sensitive coastal estuaries and riverine habitats.
Chihuahua State (Alternative Origin) registers a biodiversity score of 0.501 [MEDIUM]—a -41.1% reduction in ecological pressure compared to Sinaloa.
- Deforestation Exposure
Sourcing from Chihuahua reflects a 0.000 deforestation score, confirming zero land conversion pressure.
- Water Stress & Scarcity
Both states exhibit active irrigation pressure (Sinaloa at 0.470 and Chihuahua at 0.497), reflecting agricultural water dependencies across northern arid belts that require verified irrigation management.
- Overall Sustainability Priority
While Sinaloa carries a High/Medium overall priority ranking, Chihuahua’s overall score drops to 0.280 [LOW], demonstrating that alternative growing basins within the same country carry substantially lower aggregate environmental pressure.
National baselines provide a helpful macro-level backdrop, but sub-national data reveals the specific ecological and operational conditions that determine sourcing risk.
What this means for buyers, procurement teams, and brand owners
CommodityMap does not replace food safety audits, supplier verification, or recall procedures. Instead, CommodityMap allows buyers to ask critical questions before a disruption occurs:
- Where was this commodity likely grown?
Estimating points of origin when tier-2 supplier visibility is incomplete.
- How concentrated is our sourcing exposure?
Understanding portfolio dependence on specific growing regions.
- Which environmental and governance risks require private verification?
Identifying where high governance risk warrants mandatory private audit certifications (such as PrimusGFS or GlobalGAP) and routine microbiological water testing.
- What trade-offs arise when switching suppliers?
When companies must pivot during a supply shock or recall, the first available alternative is not necessarily the best long-term option. CommodityMap enables sourcing teams to evaluate whether an alternative state—such as moving from Sinaloa to Chihuahua—solves an immediate issue while introducing different water, ecological, or labor trade-offs.
Better information supports better decisions
CommodityMap could not have predicted this outbreak. That is not its purpose.
Its value is helping companies understand where agricultural commodities originate and which environmental and governance priorities define those regions.
With that insight, buyers, procurement teams, and brand owners can move from reactive recall management to proactive due diligence, stronger supplier standards, and more resilient sourcing networks.
The central question is simple:
Do you know where your ingredients were grown, or do you only know where you purchased them? CommodityMap can support risk assessment in either scenario.
Explore further
Review FDA Outbreak Information: FDA Recall Investigation
Sponsor CommodityMap to keep it free
Methodology note: This analysis used CommodityMap’s “Peppers” model. Baseline scenarios utilized a normalized volume of one metric ton. The first analysis modeled likely origins from U.S. purchasing data; subsequent analyses incorporated sub-national spatial resolution for Sinaloa and Chihuahua, Mexico. CommodityMap indicators describe sourcing exposure and sustainability priorities; they are not evidence of contamination or causation.
#CommodityMap #SupplyChainVisibility #ResponsibleSourcing #FoodSafety #Procurement #RetailSustainability